Exploring Microsoft.Data.Analysis for C# in a .NET Interactive Notebook
December 9, 2021Tags: data-analysis, microsoft-data-analysis, csharp
I have a thing for Python and pandas when it comes to data analysis. However, my friend Matt Groves is coordinating CSAdvent. So in sticking with the C# theme, I’m seeing what’s out there for data analysis in the C# space. I came across this blog post on the .NET blog that introduced a DataFrame and decided to explore this more. Microsoft.Data.Analysis is available on the NuGet Gallery: NuGet Gallery - Microsoft.Data.Analysis 0.19.0!
In this adventure, we will explore the December 2021 Public Holidays data source from the Public Holidays Dataset on Azure Open Datasets. We are using Microsoft.Data.Analysis to work with data in C#, hopefully with similar functionality to pandas with a C# mindset. Let’s see what we can find!
You can follow along by creating a .NET interactive notebook from scratch or check it out within my Graphmas repo.
If you are following along in your own notebook, you will need to bring in the Microsoft.Data.Analysis package with the following command:
#r "nuget: Microsoft.Data.Analysis, 0.19.0"
Disclaimer: I still haven’t found any non-Python examples for the Azure Open Datasets. So I used Python + pandas to import the data and then export it to a CSV. Our Python dataframe is known as hol_df and may be referred to throughout this post. We are working with the December 2021 Public Holidays export. The code below will bring in the data from the exported holidays file.
using Microsoft.Data.Analysis;

// Load data like pd.read_csv()
var holidayData = DataFrame.LoadCsv("DecemberPublicHolidays.csv",separator:',',header:true);
Exploring the Data
When I first am dropped in a dataset, there are some metrics I like to explore – including row and column counts, descriptions, and info. Let’s look at how to do this with Microsoft.Data.Analysis. When there are important differences, I will include how it differs from the output in pandas.
Counts
Let’s look at row and column counts.
// How many rows?
holidayData.Rows.Count
107
// How many columns?
holidayData.Columns.Count
7
The one thing I haven’t seen count-wise in Microsoft.Data.Analysis that I do have in pandas is .shape. This includes the number of rows and the number of columns. Calling .shape on my pandas DataFrame returns this result:
(107, 6)
Notice that the pandas DataFrame shows 6 columns. The index column is not counted in its results. You should be aware of that when we look at the column details.
Column Details
When it comes to looking at the imported data, notice how the Columns property of a DataFrame includes the index, type, and value. I’m excited to see that it imported the datetimes as a DateTime type.
// What are the columns?
holidayData.Columns
Output includes index, type, and value samples. Most types are Microsoft.Data.Analysis.StringDataFrameColumn, with the exception of indexes 0 – Microsoft.Data.Analysis.SingleDataFrameColumn – and 6 – Microsoft.Data.Analysis.PrimitiveDataFrameColumn<System.DateTime>.
The pandas equivalent for showing columns is: .columns.
This is what the output looks like from pandas:
Index(['countryOrRegion', 'holidayName', 'normalizeHolidayName', 'isPaidTimeOff', 'countryRegionCode', 'date'], dtype='object')
So the Microsoft.Data.Analysis output gives us more to go on – including data type and sample data.
Information
We can learn about columns and their non-null observations by calling .info() in pandas. The output from pandas looks like this:
<class 'pandas.core.frame.DataFrame'>
Int64Index: 107 entries, 26952 to 27058
Data columns (total 6 columns):
 #   Column                Non-Null Count  Dtype
---  ------                --------------  -----
 0   countryOrRegion       107 non-null    object
 1   holidayName           107 non-null    object
 2   normalizeHolidayName  107 non-null    object
 3   isPaidTimeOff         8 non-null      object
 4   countryRegionCode     91 non-null     object
 5   date                  107 non-null    datetime64[ns]
dtypes: datetime64[ns](1), object(5)
memory usage: 5.9+ KB
Let’s look at the .Info() from Microsoft.Data.Analysis.
holidayData.Info()

The .Info() output renders horizontally, showing column types – such as System.Single, System.String, and System.DateTime – across index 0. The number of non-null values run across index 1.
While the C# equivalent shows the values horizontal rather than vertical, the .Info() output is close. However, notice that Python has different non-null values. I suspect C# is treating empty values as empty strings rather than nulls. Let’s look at the data.
Peeking at the Data
We can peek at the data in pandas by using head(). This is what the first 5 records looks like in Python:
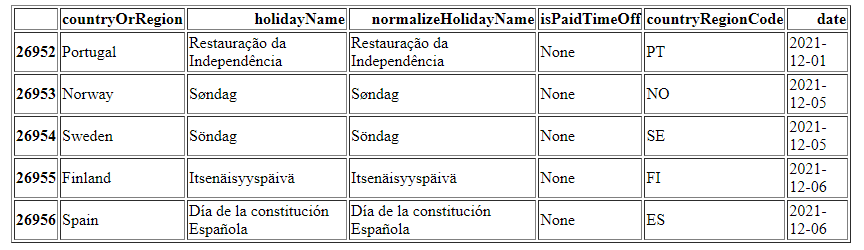
Note: We generated the table by calling hol_df.head().to_html(). Thanks for that help, pandas!
How do we do peek at the data in C#?
Let’s see if following the pattern makes sense.
holidayData.Head()
Error: (1,13): error CS7036: There is no argument given that corresponds to the required formal parameter 'numberOfRows' of 'DataFrame.Head(int)'
As of this writing there isn’t a default value for .Head() in Microsoft.Data.Analysis. Let’s pass in 5.
holidayData.Head(5)
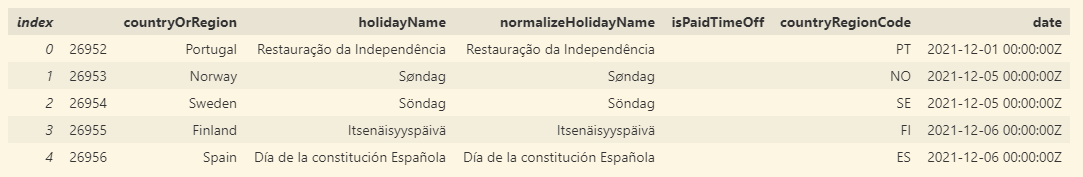
The output includes the same columns as the pandas output but renders values differently.
There seems to be generated index values versus row numbers. The columns look fairly similar in values except for the isPaidTimeOff column – which shows None in pandas and is an empty string in the C# output.
Much like there’s .head(), there’s also .tail() to look at the last entries. Microsoft.Data.Analysis has .Tail(), which also does not have a default value assigned to it. So if you are working with this, make sure to pass in the number of rows to return.
Looking at Values and Counts
In Python, we can call the column off the Data Frame. Can we do that in C#?
holidayData.countryOrRegion
Error: (1,13): error CS1061: 'DataFrame' does not contain a definition for 'countryOrRegion' and no accessible extension method 'countryOrRegion' accepting a first argument of type 'DataFrame' could be found (are you missing a using directive or an assembly reference?)
So dot-notation is out. Let’s try subscripting. In pandas, that looks like this: hol_df['countryOrRegion'].
holidayData["countryOrRegion"]
The first 20 values appear for the countryOrRegion column.
So we can use subscripting with double quotes. Can we get counts for each of the values?
Consider the following Python:
hol_df['countryOrRegion'].value_counts()
This is a sample of the output:
Sweden              7
Norway              5
Wales               4
Australia           4
Finland             4
...
Czech               3
Italy               3
Mexico              3
Denmark             2
Germany             2
Croatia             2
...
Ukraine             1
Belgium             1
Brazil              1
Now let’s look at this with .ValueCounts() for DataFrameColumn in Microsoft.Data.Analysis.
holidayData["countryOrRegion"].ValueCounts()
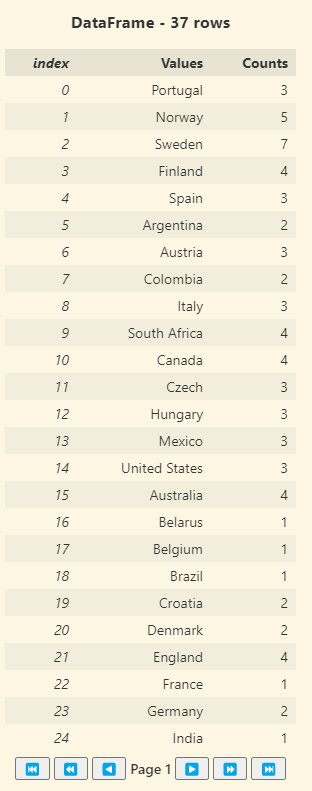
The .ValueCounts() results are shown with the header of DataFrame – 37 rows. The results are paginated with 25 results per page.
Python’s results came pre-sorted. Can we sort the C# results? I don’t know if .ValueCounts() is returning a DataFrame. Let’s try something.
holidayData["countryOrRegion"].ValueCounts().Sort("Counts")
Error: (1,46): error CS1061: 'DataFrame' does not contain a definition for 'Sort' and no accessible extension method 'Sort' accepting a first argument of type 'DataFrame' could be found (are you missing a using directive or an assembly reference?)
This confirms my suspicions that .ValueCounts() is returning a DataFrame. But… wait a minute. That blog post mentioned a Sort method. This error message makes it sound like it isn’t supported, at least not as it blogged.
Thankfully, Microsoft.Data.Analysis is open source. I did some digging to find where .Sort() lives and found it in Microsoft.Data.Analysis/DataFrame.cs on GitHub. Sure enough, there’s no default value on the isAscending parameter. To make things more confusing, I could use OrderBy() with just the column name, where the isAscending is defaulted to true. Or I can call OrderByDescending(), where the isAscending is defaulted to false. So let’s sort our value counts:
holidayData["countryOrRegion"].ValueCounts().OrderByDescending("Counts")
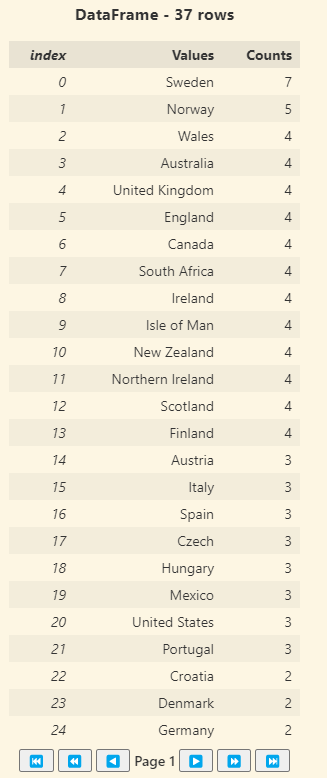 )
)
The .ValueCounts() results are shown with the header of DataFrame – 37 rows. The results are paginated with 25 results per page. The results are sorted with the Counts highest to lowest.
Conclusion
The more I looked at the GitHub repo, the more I realize that Microsoft.Data.Analysis is part of the ML.NET data prep story, based on this issue with a question on Microsoft.Data.Analysis package development. So it’s very much a work in process. I’m going to stay tuned to the ML.NET data prep / wrangling / exploration story, as I would love to see a solution in C# similar to the pandas capabilities in Python.